This bar chart expertly dismantles Donald Trump’s attack on ‘violent’ London

Donald Trump’s been on Twitter again saying London mayor Sadiq Khan – wonder what it is about him that Trump dislikes so much? – is a “disaster” because of violent crime rates in London.
And he retweeted Katie Hopkins to do it.
LONDON needs a new mayor ASAP. Khan is a disaster – will only get worse! https://t.co/n7qKI3BbD2
— Donald J. Trump (@realDonaldTrump) June 15, 2019
That’s not why we’re here – this is, a graphic which expertly dismantles Donald Trump’s so-called attack on the UK’s capital city and its mayor.
What a shame it’s probably too complicated for the so-called president to understand.
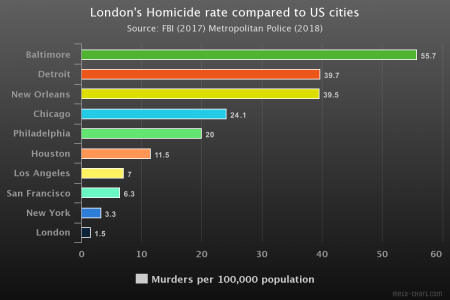
Donald Trump says Sadiq Khan is a “disaster” because of violent crime rates in London.
Here’s how London’s homicide rate compares to US cities. https://t.co/hqhoMfboIx pic.twitter.com/kcDmLXISx6
— Adam Bienkov (@AdamBienkov) 16 June 2019
And a few other very good points people made in response.
You are not only far more likely to be murdered in DC than London, you are also far more likely to be murdered *specifically with a knife* in DC than in London. America's whole view of Europe is warped.
— Hugo Rifkind (@hugorifkind) 16 June 2019
Results skewed by not including Midsomer though
— Andrew Wilshire (@AndrewWilshire) 16 June 2019
London is still very much safer than the average USA high school.
— J. Starling (@tillysbrae) 16 June 2019
If only we could figure out some reason Trump would try to pick a public fight with London’s mayor 🤔
— Brooke Binkowski (@brooklynmarie) 16 June 2019
READ MORE